A quick comparative lead-in
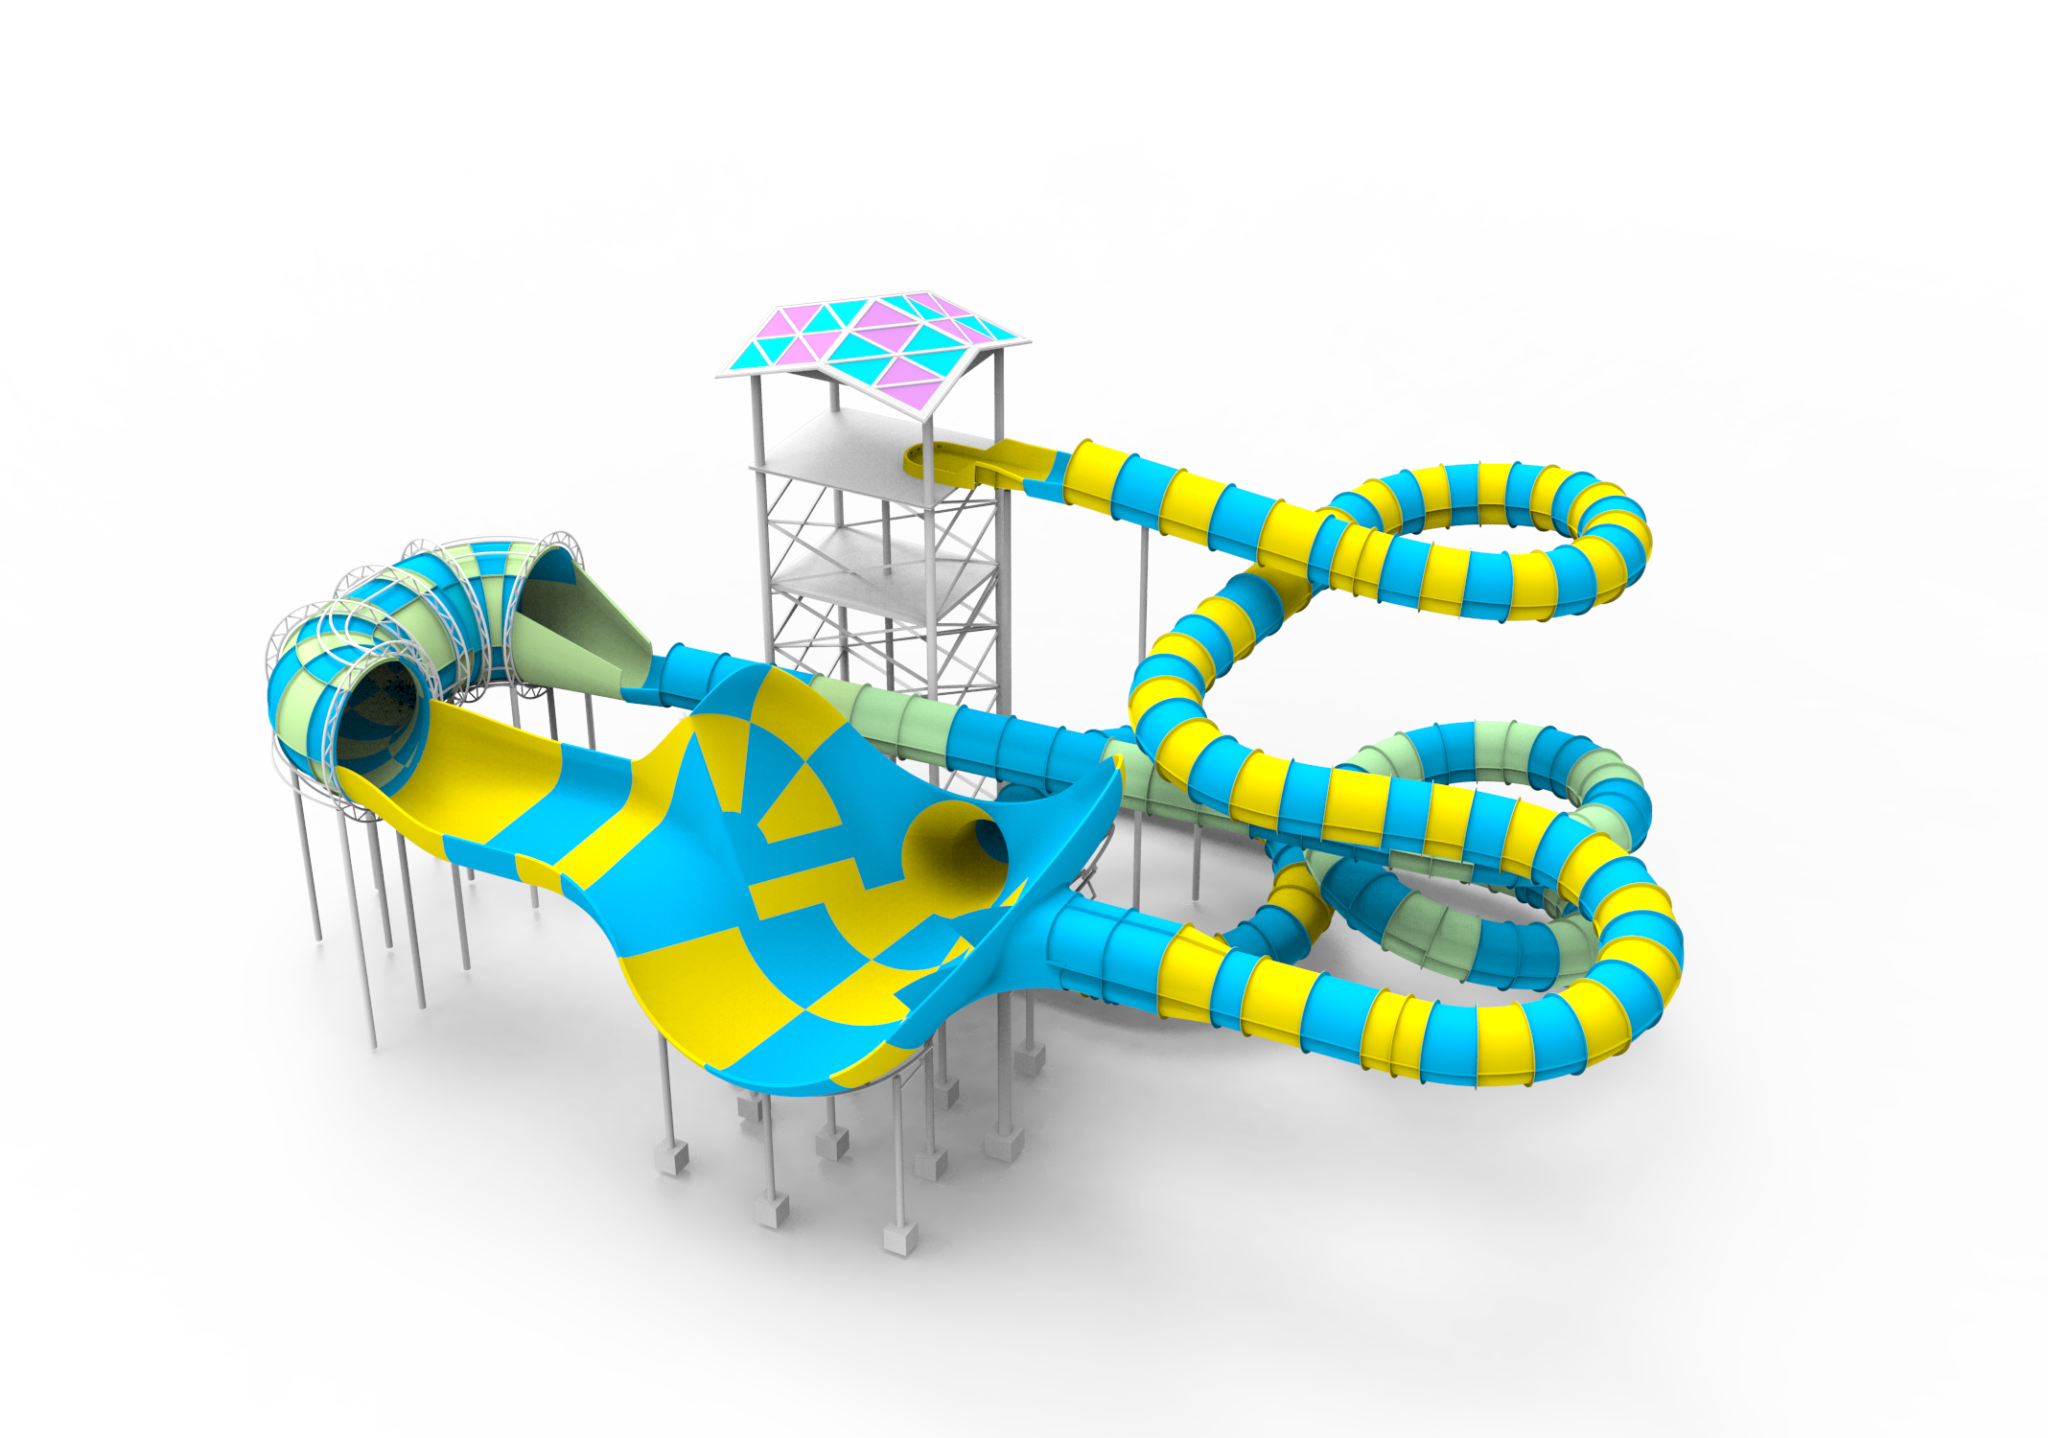
When parks weigh price against performance, the calculus must be precise. This piece compares direct-manufacture pricing in China with real-world operational outcomes, starting from quoted unit cost to years of maintenance. Many operators now look at marquee pieces like the tornado water slide as bellwethers: cost looks attractive on paper, but throughput and wear patterns tell the full story. The IAAPA Expo in Orlando provides a useful anchor: it’s where buyers and Chinese fabricators often reveal how design choices translate into daily capacity and lifecycle cost.
What the headline price omits
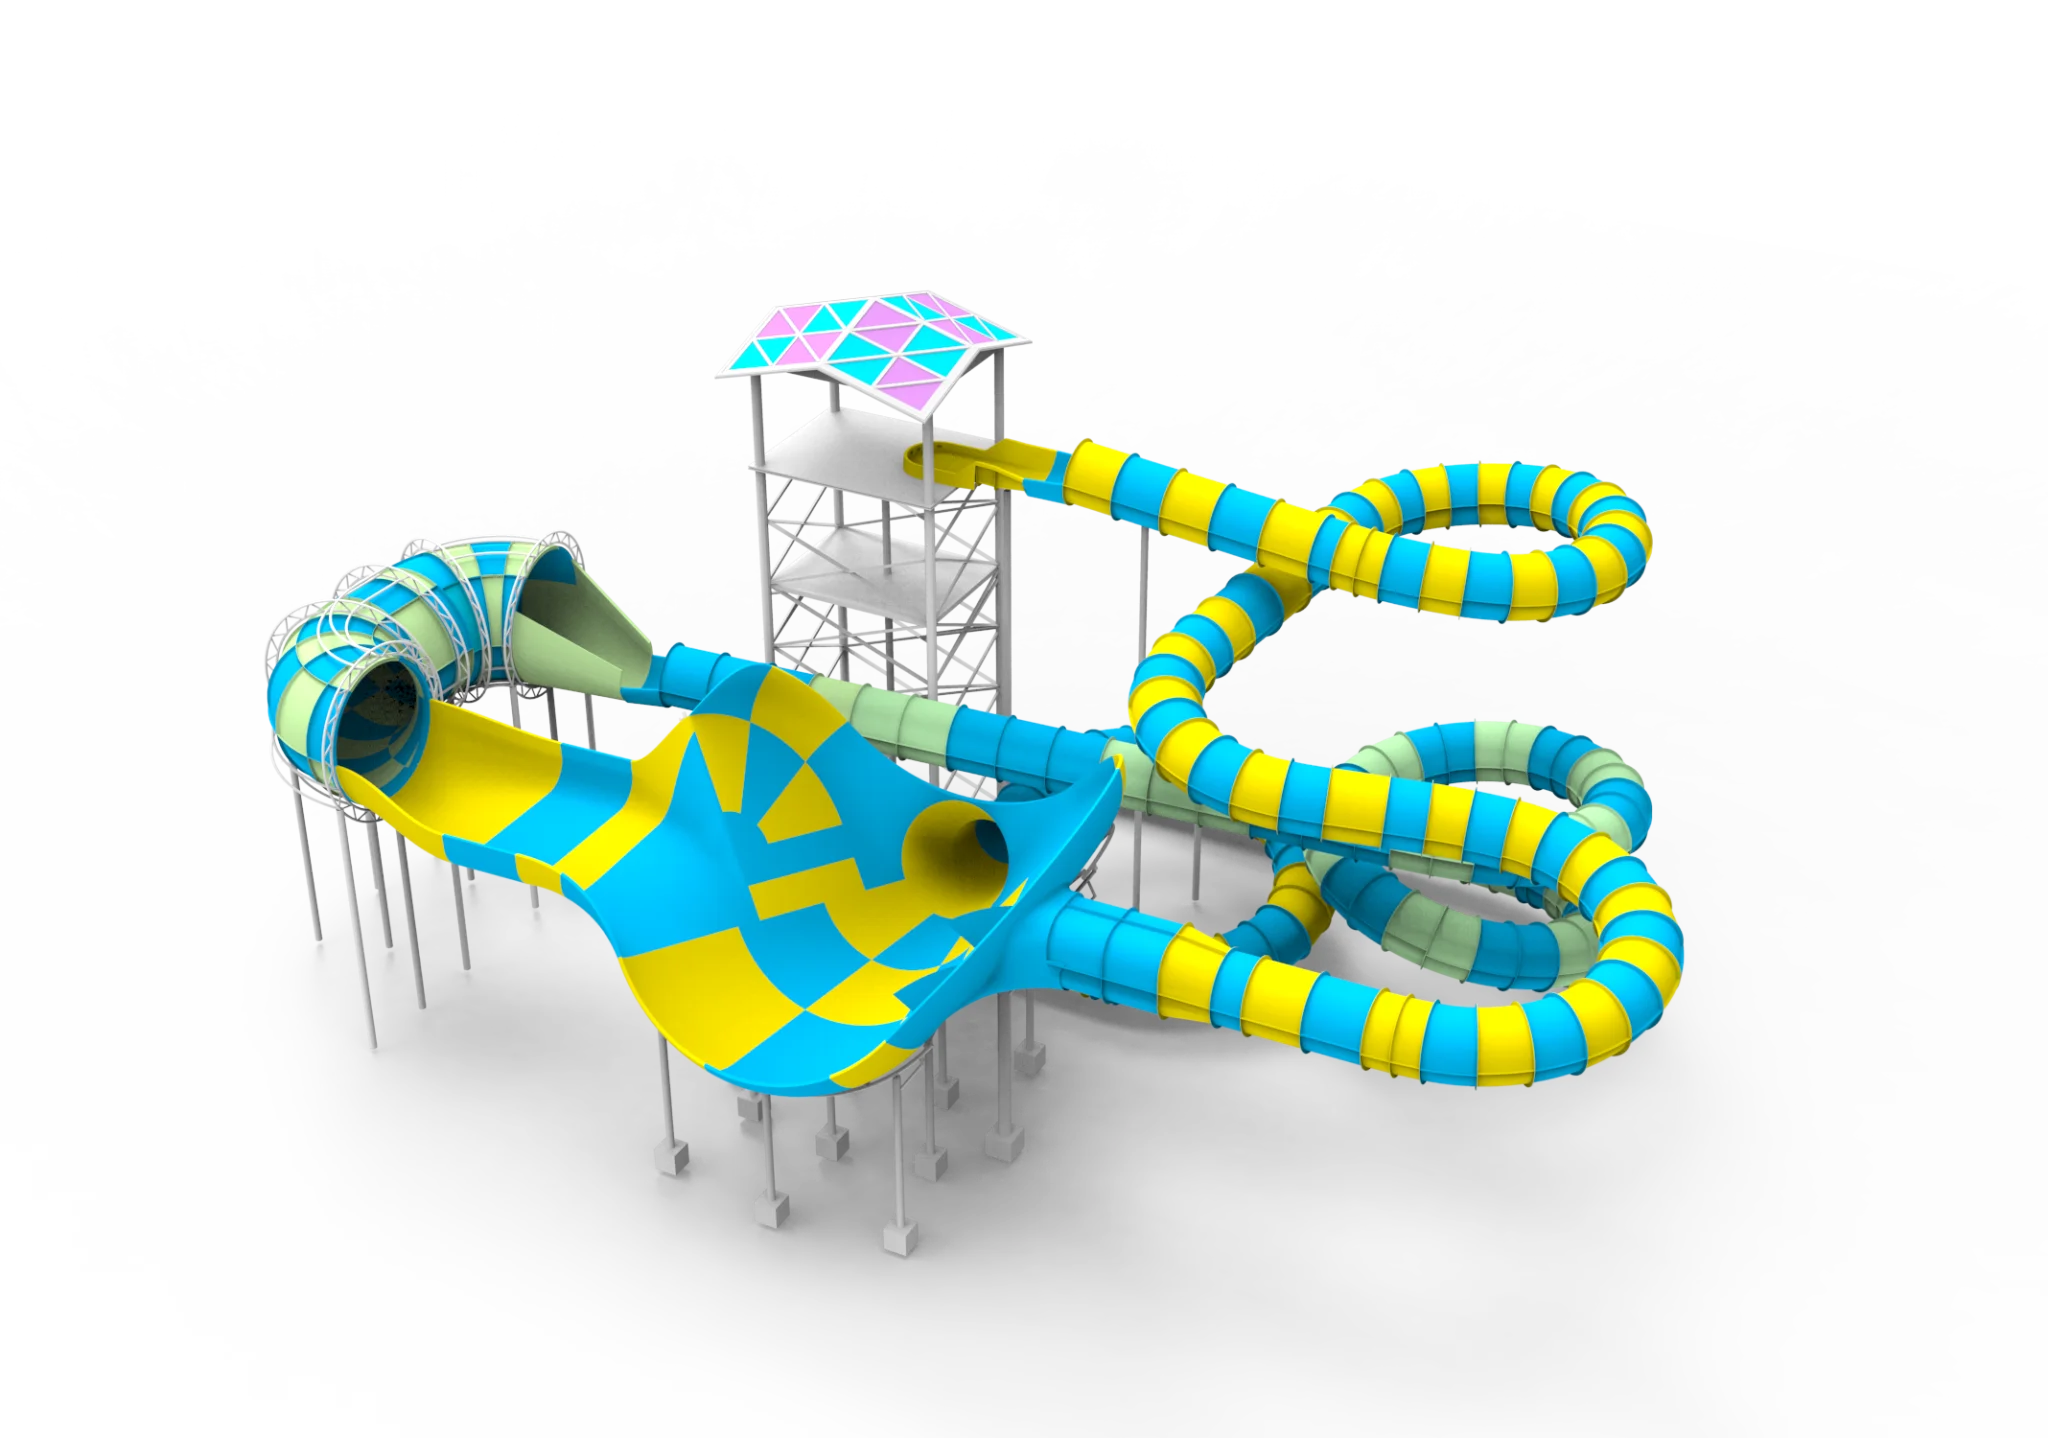
Manufacturers in China can undercut local suppliers on per-unit manufacturing cost. However, the final cost includes freight, customs handling, local installation, and adaptation for local codes. Expect added line items for site-specific foundations, water-treatment hookups, and lifeguard sightline adjustments. Consider gelcoat repair intervals and the cost of replacement sections for FRP components when building a total cost model. In short: low FOB price rarely equals low total cost.
Performance drivers that matter
Performance breaks down into ride quality, safety, and operational throughput. Materials and engineering choices—wall thickness of FRP, UV stabilizer in outer coatings, drainage and scupper design—drive longevity and guest experience. A well-engineered slide maintains rider speed and reduces splash-erosion; a poor one raises maintenance and insurance costs. If you’re comparing models, include a technical teardown: test reports for structural load-bearing points, gelcoat adhesion, and joint fasteners. The popular Super Bowl slide style, for example, demonstrates how profile curvature and entry geometry affect both thrill and water use.
Common sourcing mistakes—and how they skew results
Buyers often skip a formal factory audit, or they accept prototype photos without witnessed testing—costly oversights. Language gaps and ambiguous specifications create “spec drift” during production; the result is mismatched fixtures or incompatible pumps. Also, freight consolidation savings can be offset by long lead times that force parks to seasonally delay openings. Insist on witnessed load testing and documented maintenance intervals. —A mid-size operator once saved on freight only to pay more in retrofit costs the following year.
Alternatives and comparative options
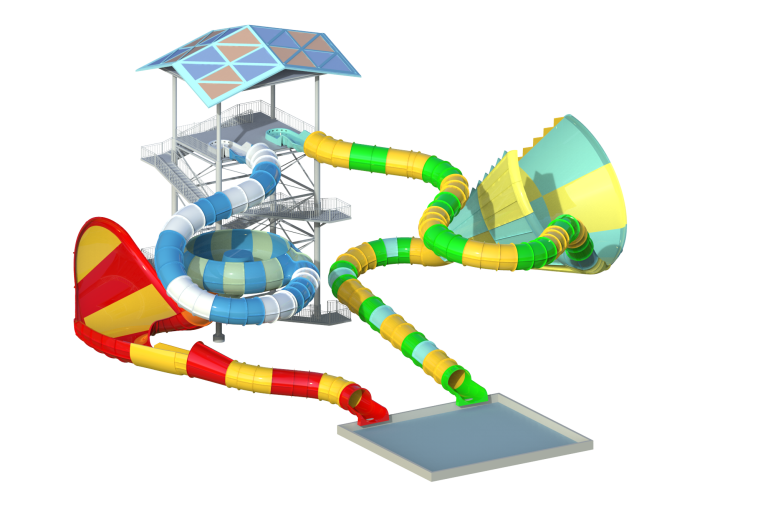
Pure import is one route. Hybrid procurement—sourcing molds and critical components from China while doing final assembly and finishing locally—often balances cost and control. Domestic builders charge premiums but offer faster response for warranty work and local code compliance. When you model options, include lifecycle metrics: energy use per rider, repaint/gelcoat cycle, and replacement-part lead times. In the operational production teardown, factors labeled {main_keyword} and {variation_keyword} often determine final margins, so track them alongside hard costs.
Due diligence checklist
Concrete checks reduce surprises: factory visit with a structural checklist, witnessed pressure and fatigue testing, inspection of gelcoat thickness and adhesion, and a shipping plan that accounts for seasonal port delays. Capture expected throughput in peak hours and model staff costs for lifeguard rotation. Add spare-section inventory into the budget—fast fixes lower downtime and protect season revenue.
Three metrics to decide confidently
Choose three evaluation metrics and hold suppliers to them: 1) True lifecycle cost per 1,000 riders (includes maintenance, energy, and parts); 2) Verified throughput under peak conditions with documented test runs; 3) Time-to-warranty-resolution, measured in calendar days. These metrics translate price and promises into predictable results and help compare bids objectively. They also align procurement decisions with on-the-ground operations—where value is really realized. Dalang.