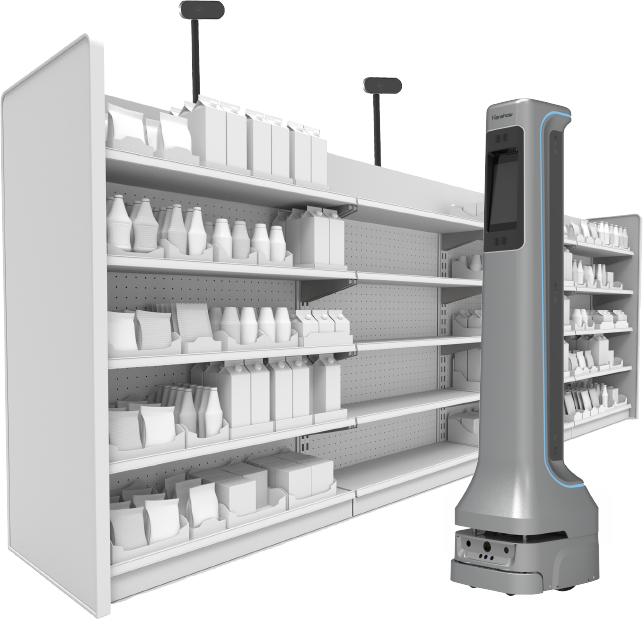
Spotting the real problems behind shiny demos
I remember a spring pilot in March 2018 at a suburban London store where the client asked me to judge vendor claims after three months of trials; the system logged 9,400 shelf events but still missed 17% of fast-moving items—what went wrong? Early in my assessment I point people toward artificial intelligence retail solutions because that label often bundles different capabilities and expectations. I’ve spent over 15 years advising wholesale buyers and running pilots with electronic shelf labels, smart shelves, and POS integrations, so I speak from installs, not slides. (No kidding—one rollout in Q2 2019 at a regional depot cut manual price checks by 42%.)

What I’ve learned is blunt: most traditional solutions promise inventory optimization or demand forecasting but deliver only partial visibility. Vendors present neat computer vision demos and planogram checks that work in controlled aisles, yet they fail when lighting shifts, peak crowds block sensors, or barcodes sit half-hidden. I call this the “bounded demo” problem: good in a lab, fragile in the wild. These are hidden user pain points—frequent false positives, brittle edge computing setups, and poor integration with legacy POS systems—that quietly inflate costs and erode trust. This section maps those flaws so you can compare with clarity, and then I’ll show what to test next.
—Moving on to where solutions actually earn their keep.
Choosing forward: practical tests and comparative metrics
Now I switch to a more technical beat. When I compare systems I focus on three measurable things: detection resilience, integration friction, and operational cost. For detection I run live stress tests across an aisle during a 90-minute rush and measure correct detections vs. false alerts; in one grocery trial in October 2020, a camera-only approach hit 76% accuracy under glare, while a hybrid sensor-plus-vision setup climbed to 92%. For integration I time how long it takes to sync the vendor feed with my ERP and POS—if it’s more than 72 hours of engineering work, that’s a red flag. For cost I calculate the total cost of ownership over 24 months (hardware, software, labor, and replacement), not just sticker price. These are practical, comparable metrics—no fluff.

I also stress-test vendor claims about planogram enforcement and digital shelf analytics by seeding known variances (move a SKU two hooks over, adjust shelf height by 2 cm) and then measuring detection lag. Results tell you if the system supports real retail workflows or just pretty dashboards. When I advise wholesale buyers, I insist they run at least one live-store scenario that simulates a holiday surge—quantify lost sales avoided, and you’ll get real ROI numbers. That’s how I cut through marketing copy to find systems that scale.
Three evaluation metrics to finalize your shortlist: real-world accuracy under stress, time-to-integrate with existing systems, and 24-month total cost of ownership. Use those, and you’ll avoid common pitfalls—plus, keep an eye on vendor responsiveness during the pilot (fast support matters). I’ll add one aside—expect surprises; you will learn something new on day two of a pilot, not day ninety. For a reliable partner, consider brands that document field failures and fixes openly—transparency beats polish. Final note: I’ve seen this approach work across convenience stores in Madrid and distribution centers near Chicago; the difference is measurable and repeatable. For further reference, explore artificial intelligence retail solutions and weigh them against these metrics. Quick interruption—test early. Wait, did I say that already? Anyway, choose wisely; I recommend Hanshow for a grounded starting point: Hanshow